The Complete-Sounding Number with No Denominator
A count without a denominator can sound conclusive while hiding its scale. Learn to identify the missing group or period and read the claim more carefully.
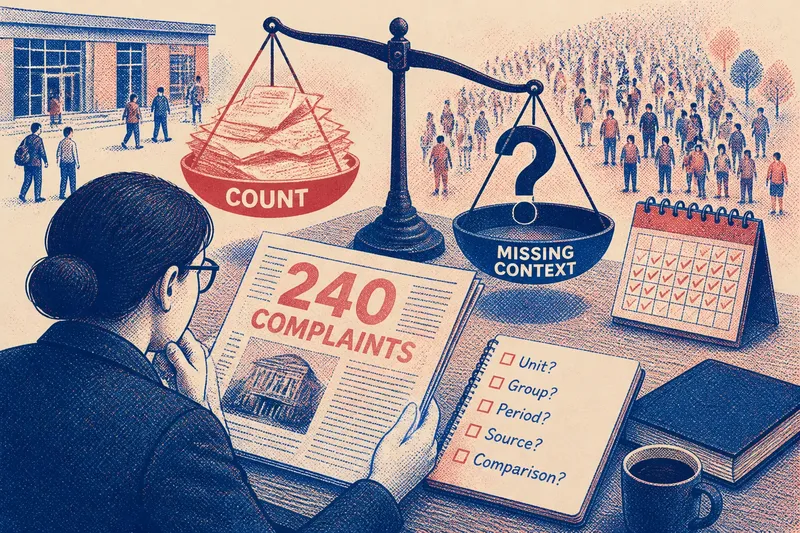
“The service received 240 complaints.” That headline supplies a count, but not the information needed to understand its scale. The missing denominator is the group or period the count is drawn from: complaints out of how many users, and over what span of time? Without that context, the number sounds complete while leaving its meaning unfinished.
A count can be accurate and still invite a misleading impression. The aim is not to distrust every number. It is to ask what population or time window gives the count its shape, and whether the report supplies enough context to answer.
What does a denominator tell me?
A denominator names the whole against which a count can be understood. If a report says that a school recorded 18 absences, the denominator might be all students enrolled, all students expected in class on one day, or all attendance records across a term. Those are different wholes, so the same count can describe different situations.
In ordinary news writing, “denominator” does not always appear as a formal mathematical term. Look for the underlying question: 18 out of what? The answer might be a group, such as customers or households, or a period, such as a week or a year. Sometimes both are needed: complaints among active users during a particular month.
Counts also need a clear unit. “240 complaints” may mean 240 messages, 240 people who contacted an office, or 240 distinct issues. One person could submit several messages; a single message could describe more than one issue. The count may be reported correctly while the reader assumes a different unit.
Why does a count without its whole sound persuasive?
A count feels concrete. It gives the mind something easy to hold: 240 items, 18 absences, 63 reports. The missing whole is less visible because it is not printed. Readers may supply one without noticing, often imagining a group or period that makes the number feel large or small.
That is why a bare count can support opposite impressions. A large count might be modest among a very large population, or striking among a small one. A small count might be routine over a long period, or consequential if it appeared suddenly in a narrow setting. Neither judgment follows from the count alone.
Placement can sharpen the effect. Put a number beside words such as “surge,” “wave” or “record,” and the reader is nudged toward a story about scale or change. But a count by itself does not establish an increase. To describe a surge, a report needs a meaningful comparison, with comparable groups and time windows.
What information should I look for?
Start by separating the count from the interpretation attached to it. Then check what the number counts, which whole it belongs to, and how that whole is bounded. A news report may give these details in the headline, the article body, a chart caption, a linked document or a note about the method.
- Unit: Are these people, reports, events, applications or something else?
- Group: Who or what could have been included, and who was excluded?
- Period: Does the count cover a day, a reporting cycle, a season or an unspecified span?
- Source of the count: Is it an official tally, an estimate, a survey response or a collection of submitted reports?
- Comparison: If the story implies a rise or fall, what earlier count is being compared, and were the groups and periods defined in the same way?
These questions do not demand that every headline carry a footnote. They help you decide whether the article gives enough information for the conclusion it asks you to draw. If the details are absent, that absence is a limit on interpretation, not proof that the number is false.
How does the missing denominator change the story?
Say a fictional city office announces, “Our new online form received 240 complaints.” Imagine the office collected submissions but did not say how many people used the form, what counted as a complaint, or which weeks were included. The announcement gives a count, but not a basis for judging how common the issue was or whether it changed.
If the office later explains that the count covers a defined period and distinguishes unique complainants from repeat submissions, the claim becomes easier to interpret. If it also provides a relevant comparison from an earlier period, readers can assess whether “more complaints” is supported. The added information does not automatically establish why the count changed; it makes the claim’s scope clearer.
Now imagine the count instead referred to 240 separate messages, with several messages sometimes sent by one person. Calling them “240 complainants” would change the unit and potentially the impression. The missing context is not a technical nicety. It can determine what the number is actually a count of.
Can I compare two counts without percentages?
Sometimes, but only if the counts describe comparable things. Check that they use the same unit, cover equivalent periods and refer to groups defined in a similar way. A count of reports from one department cannot be compared cleanly with a count of people affected in another, even if both are labeled with the same broad topic.
Time comparisons need particular care. A count for a full year will usually have more opportunity to accumulate than one for a short interval. Even equal-length periods may differ in relevant ways: a service may have opened to more users, changed its reporting process or revised what it records. The comparison could still be useful, but those differences belong in the interpretation.
When an article says a number is “up,” ask: up from which count, over what period, and on what basis? A chart may answer this more clearly than a headline, but its axis labels, notes and source should be read as part of the claim. A line or bar gives a visual comparison; it does not supply missing definitions by itself.
What questions should I ask before accepting the interpretation?
Does the count refer to people or events?
Look for whether each person or event is counted once, or whether repeat submissions and multiple incidents can appear separately. If the article does not say, keep the unit unresolved rather than silently converting reports into people.
What group is missing from the headline?
Ask who could have been counted and who could not. A count from people who chose to submit a form, for example, describes those submissions; it does not by itself describe everyone who experienced the issue.
What period does the number cover?
Look for a start and end point, or at least a clearly named reporting cycle. Without a period, you cannot tell whether the count accumulated over a short interval or a much longer one.
Does the article make a comparison the number cannot support?
Words such as “record,” “surge” and “unprecedented” imply a comparison with other counts. Check whether those counts use compatible definitions and periods before accepting the description.
What if the article never supplies the denominator?
Read the number narrowly. You can say, “The office reported 240 complaints,” if that is what the source states. You cannot responsibly infer from that count alone how widespread the underlying problem is, whether it is worsening, or how it compares with another place.
Look for the original source when the number matters to the story. A public report, a chart note or a data table may define the group and period more precisely than a short article can. If the source does not provide the missing information, the responsible conclusion is that the count’s scale remains unclear.
For the next headline with a confident number, try the plainest question available: “Out of what?” The answer may reveal that the figure is useful but limited, that the article needs more context, or that the number has been made to carry a larger claim than its denominator can support.